📊 The Numbers Behind the TEA Act
- $23.6 billion in federal TANF and WIC rollbacks since 2021 (CBO, 2023)
- 32% increase in unaccompanied youth housing requests between 2021–2023 (HUD)
- Only 1 in 5 eligible families receive full WIC benefits (USDA, 2022)
- 47 states failed to expand cash maternal care pilots despite public health warnings (KFF)
- $25 million identified in annual unused, diverted, or expired allocations at the local level (FFPA internal audit)
🧠 Interpretation
These statistics reveal the financial and human cost of federal disinvestment in social safety nets. The TEA Act proposes a model of redirected funding to ensure aid reaches communities that need it most.
📚 Source Annotations
- CBO 2023 Budget Review: Congressional Budget Office analysis of appropriations.
- HUD Annual Homelessness Report 2023: Department of Housing and Urban Development data.
- USDA WIC Program Fact Sheet (2022): Participation and eligibility gaps in child nutrition assistance.
- KFF Maternal Health Survey (2022): State policy responses to maternal care recommendations.
- FFPA Internal Review: Compilation of fiscal year-end data from local and state reports.
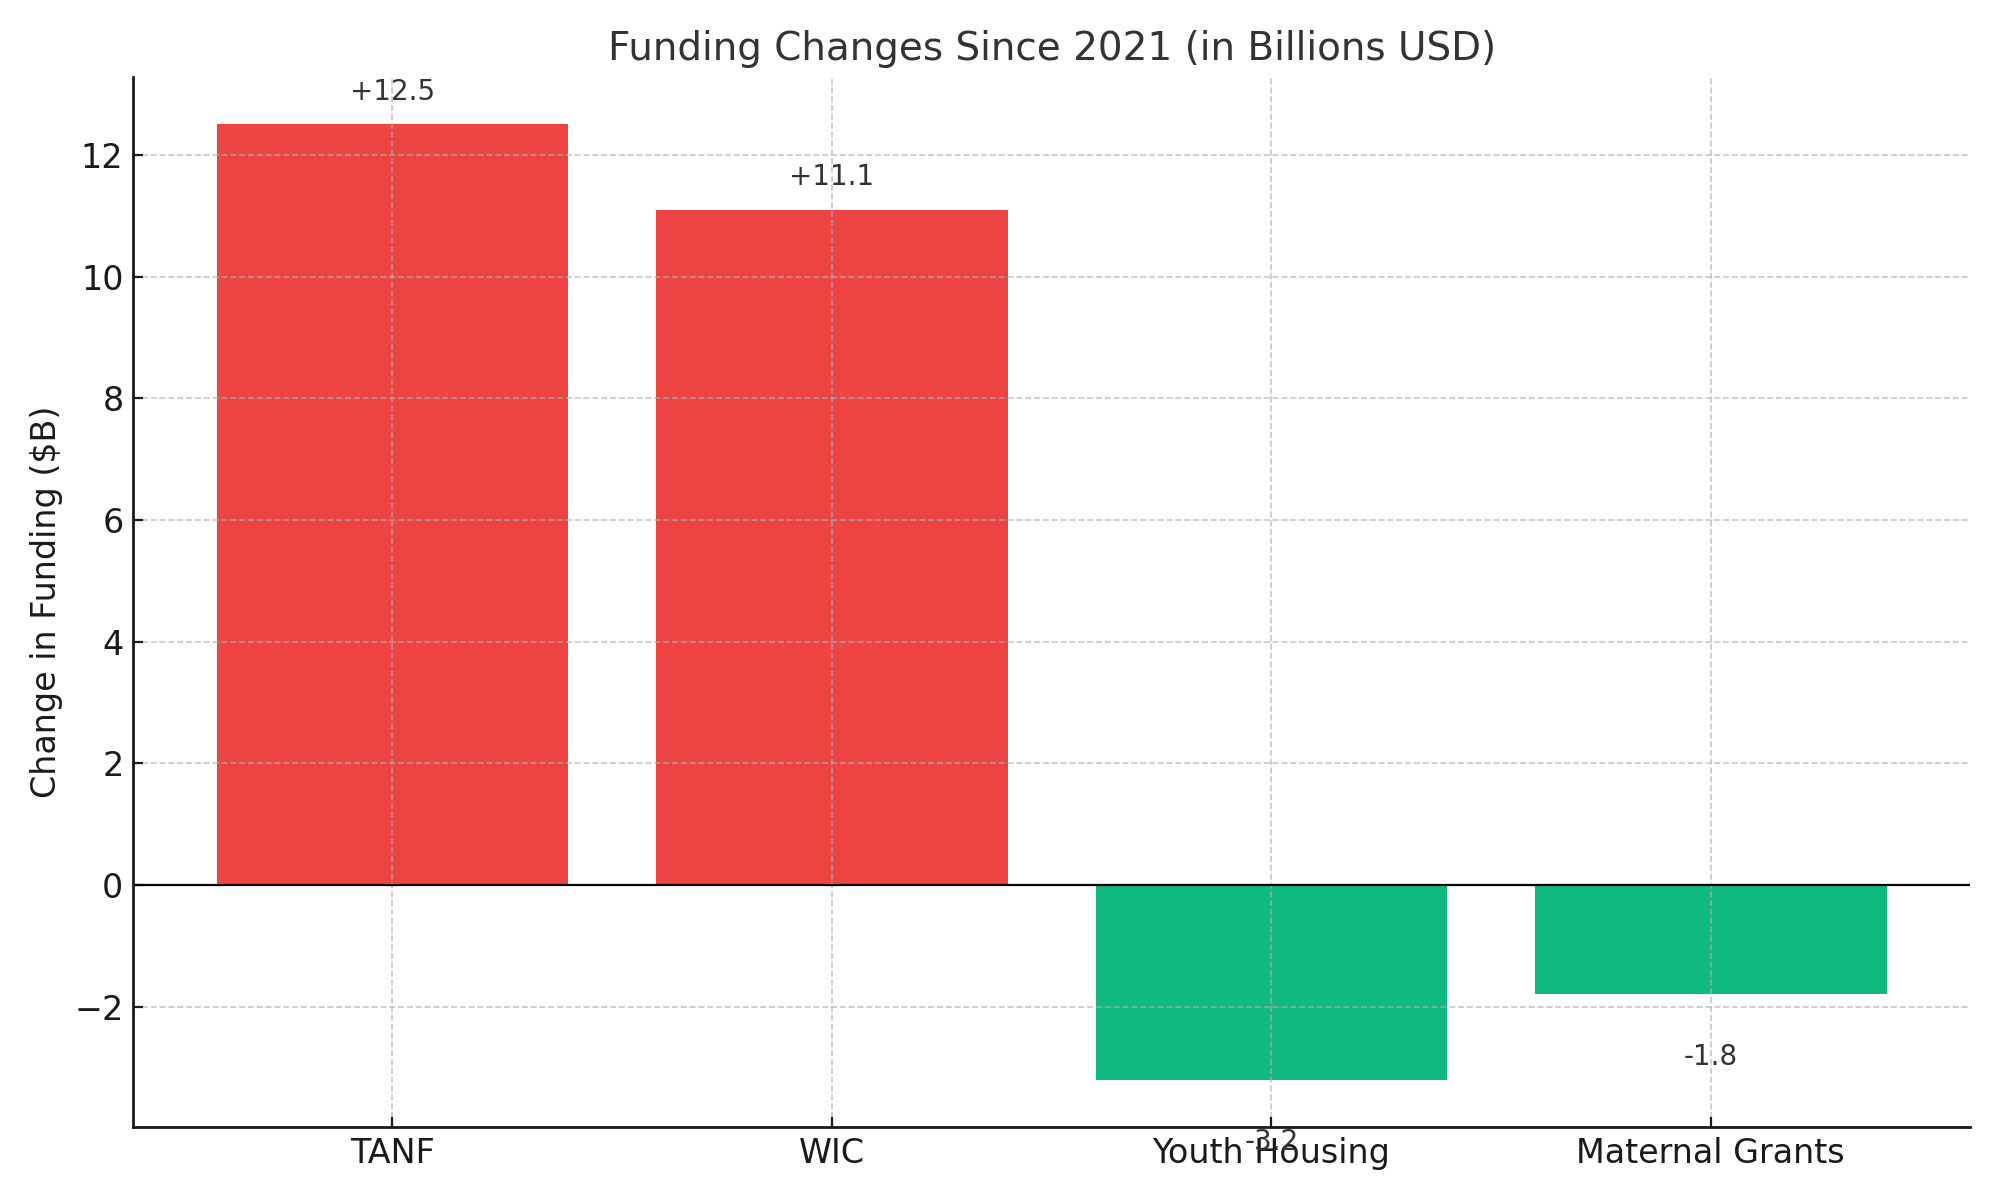
📉 Visualizing the Shift
This chart illustrates the contrast between federal budget cuts to essential programs like TANF and WIC, and the community-level reinvestments proposed by the TEA Act. While over $23 billion has been pulled from social safety nets since 2021, the TEA Act responds by shifting control to local agencies to stabilize housing, youth, and maternal health outcomes.
Red bars represent program defunding at the federal level.
Green bars reflect the TEA Act’s proposed reallocation of those lost funds — focused on direct relief and community autonomy.